From the interaction of atoms and molecules in substance
Mutual transformations of liquids and gases
44. Diagram of equilibrium states of gas and liquids
Let's return to Figure 3, which shows the isotherms of real gas. Let's connect all left ends of horizontal isotherms, i.e. all those points that correspond to the end of condensation and the beginning of liquid compression. A smooth curve ending at the critical point \(C\) is formed. Figure 4 shows this curve with a dotted line. To the left of the dotted \(AC\) curve between it and the critical isotherm (\(RC\) isotherm section) is the area corresponding to the liquid state of the substance (in Figure 4, this area is covered by horizontal dashed). Each point of this region corresponds to the parameters \(p, ~V, ~T\), characterizing the liquid in a state of thermal equilibrium.
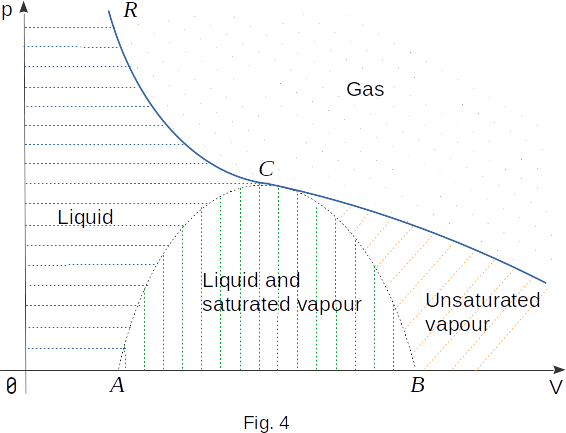
Then connect all right ends of horizontal isothermal areas with a smooth curve. This curve is also dashed and also ends at point \(C\). Two dotted lines \(AC\) and \(BC\) limit the area, each point of which corresponds to a state of equilibrium between liquid and saturated vapour (in Figure 4, this area is covered by vertical dashed).
With the exception of the liquid state and equilibrium area of the liquid with gas, the rest of the chart area corresponds to the gaseous state of the substance. Below the critical isotherm is the area of gas states from which by isothermal compression gas can converts into liquid. This gas is often called unsaturated vapour. (The unsaturated vapour area in Figure 4 is covered with a diagonal dash.) Above the critical isotherm is the gas area. At \(T>T_c\), gas properties are close to the properties of an ideal gas. With isothermal compression, the gas in this state does not turn into a liquid.