From the Heat phenomena
6. Charles's law
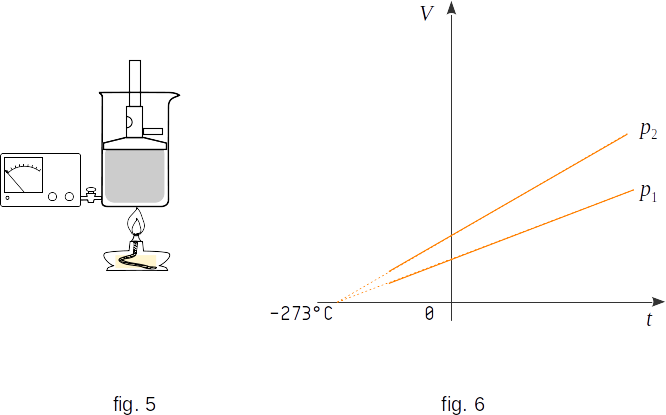
Charles's law defines direct proportion relation between the gas volume and temperature at a constant pressure. This relation can be found in experiment by observing the change in the volume of gas with changes in the temperature in the gas container. The container has vertical walls and is covered by a heavy piston that can move with very little friction (fig. 5). The gravity \(mg\) and atmospheric pressure force \(p_0S\) acting on the piston determines a constant pressure \(p\) inside the gas that is independent of its volume:
\(p = {mg \over S} + p_0\)
\(S\) is the piston square.Let's mark by \(V_0\) the volume of gas at temperature \(t=0 ^0С\). Observations show that the volume of gas \(V\) at constant pressure increases linearly with temperature. The relative change in volume \(({{V-V_0} \over V_0}) \) is directly proportional to the temperature, that is
\({{V-V_0} \over V_0} = kt \)
This equation can be written as
\( V = V_0(1 + kt) \) (1-2)
This dependence of volume on temperature is called Charles's law.
The \(k\) coefficient is called the thermal coefficient of volume expansion. It is numerically equal to the relative change in the volume of gas when it heats from \(0\) to \(1 ^0C\). Test has shown that the volume all gases increases or decreases by \(1/273\) times the volume, which each gas occupied at \(273 K (0 ^0C)\), if the temperature changes by \(1 K\).
Charles's law can be verified with the device shown in figure 5. To do this, we should mark the pressure and measure the gas temperature and volume in the container. Then we need to heat the gas. Move the piston up and down to make sure the pressure reading the same as before. Measure gas temperature and volume again. After that, change the temperature again, reach the initial pressure value, and measure temperature and volume. In this way, the equation \((1-2)\) can be seen to be fair.
The process of gas volume change by temperature change at constant pressure is called isobaric. Graphically, this dependence is represented by straight lines - isobars (fig. 6, \(~ p_2 \,> \,p_1\)). At temperatures close to \(-273 ^0C\), a solid straight line is replaced by dotted line, as the substance at such low temperatures is no longer in a gaseous state and the law \((1-2)\) is not correct.